

Introduction
Smart rechargeable night lights offer a compelling proposition for property managers: reduced nighttime falls, lower energy consumption, and fewer maintenance interventions. But the outcomes are context dependent. A carefully designed pilot test provides the evidence needed to make a confident, data-driven decision about scaling across multiple properties. This extended blueprint walks through every stage of a robust pilot, from stakeholder alignment to statistical analysis, practical device selection, staff training, resident communications, and a structured ROI framework.
Why a Pilot Matters
- Different building layouts, resident populations, and staff workflows produce different outcomes. A local pilot proves real-world impact.
- Pilots reveal installation, privacy, and usability issues before committing capital and operations resources for a full rollout.
- They let you measure hard financial benefits and intangible improvements such as resident confidence and perceived safety.
- Documented pilot results strengthen procurement negotiations and support grant or capital requests for larger deployments.
Core Objectives and Key Performance Indicators
Clarify measurable objectives before starting. Typical pilot objectives include reducing nighttime falls, cutting lighting energy use, and decreasing maintenance labor and parts related to night lighting. Define KPIs that align to those goals.
- Fall-related KPIs
- Number of nighttime falls per 1,000 resident nights
- Severity categories: no injury, minor, major, hospitalization
- Near-fall or trip reports
- Energy KPIs
- kWh consumed by night lighting per month
- Percent reduction in night lighting kWh versus baseline
- Cost savings using actual utility rates
- Maintenance KPIs
- Number of service calls related to night lighting
- Labor hours spent on lighting maintenance
- Parts replaced per year (bulbs, wiring, batteries)
- Operational KPIs
- Device uptime and percent operational without intervention
- Average battery life and number of charge cycles
- Telemetry success rate and data completeness
- Resident and staff experience
- Satisfaction scores for nighttime lighting
- Perceived safety and comfort
- Reported sleep disturbance or complaints
Assemble the Pilot Team and Secure Buy-In
A successful pilot needs a multi-disciplinary team and visible executive support.
- Stakeholders to include
- Property manager or regional manager
- Maintenance supervisor and technicians
- IT or systems administrator (for telemetry, connectivity)
- Health or wellness staff for senior living properties
- Procurement representative
- Resident or tenant liaison
- Legal/compliance for privacy and lease considerations
- Secure executive sponsor support to ensure resources and faster decision-making.
- Create a one-page charter documenting objectives, KPIs, budget, timeline, and decision criteria for scale or stop.
Site Selection and Experimental Design
Choose pilot locations to represent the diversity of your portfolio. Use an experimental design to isolate the effect of the night lights.
- Site selection tips
- Include different building types: single story, multi-story, long corridors
- Target high-risk zones such as bathrooms, hallways, stairs, and bedroom exits in senior housing
- Consider varying lighting baselines: properties with LED corridors vs properties using incandescent night lights
- Design approaches
- Randomized controlled trial when possible: randomly assign matched units to treatment and control
- Matched-pair design: match treatment units with similar control units by age, mobility risk, and layout
- Before-and-after with control: collect baseline metrics, introduce devices in treatment group, and compare against controls
- Sample size guidance
- Falls are usually rare events. Aim for larger sample sizes or longer pilot duration to detect meaningful reductions.
- As a rule of thumb, 25 to 50 units per cohort over 8 to 16 weeks is a pragmatic minimum. For older populations or high-risk settings, align with your baseline event rates and consult a statistician for power calculations.
- If fall rate is 0.05 falls per resident-month, detecting a 50 percent reduction requires many resident-months; you can increase duration or number of units to gain statistical power.
Baseline Data Collection
Collect high-quality baseline data for comparison. Poor baselines undermine analysis.
- Baseline data checklist
- Fall logs with date, time, location, injury severity, witness, and context
- Existing nighttime lighting inventory: fixture types, wattage, lumen output, and schedules
- Energy consumption for lighting at night: use submeters if available or estimate from runtime and wattage
- Maintenance logs: calls, labor hours, parts used, and costs for lighting-related tasks
- Resident and staff surveys on lighting quality, perceived safety, and any sleep disturbance
- Floor plans and installation points with photos for each unit or corridor
- Record at least 4–12 weeks of baseline data. Longer baselines reduce noise from short-term fluctuations.
Device Selection: Technical and Operational Criteria
Choosing the right device matters as much as pilot design. Evaluate devices across technical performance, safety, maintainability, and vendor support.
- Technical criteria
- Battery capacity and rated cycles, and real-world battery life estimates
- Sensor type and field of view: passive infrared, microwave, or hybrid; adjustable sensitivity
- Light output: lumens, color temperature, and dimming capability
- Activation behavior: motion-triggered, ambient-light gated, or scheduled
- Connectivity options if telemetry desired: Bluetooth, Zigbee, LoRaWAN, Wi-Fi
- Firmware update support and security practices for connected devices
- Operational criteria
- Mounting options for walls, baseboards, or existing fixtures without invasive wiring
- Swap and charging procedures for rechargeable batteries; spare battery strategy
- Vendor training, warranty, and replacement terms
- Availability of sample devices for small-scale testing before full pilot
- Safety and compliance
- UL or equivalent safety certifications
- Battery safety: overcharge, thermal runaway protection
- Disposal and recycling program for batteries at end of life
- Procurement and cost
- One-time device cost, replacement battery cost, expected lifetime
- Optional recurring costs like cloud platform fees
- Bulk discount expectations and vendor references in similar facilities
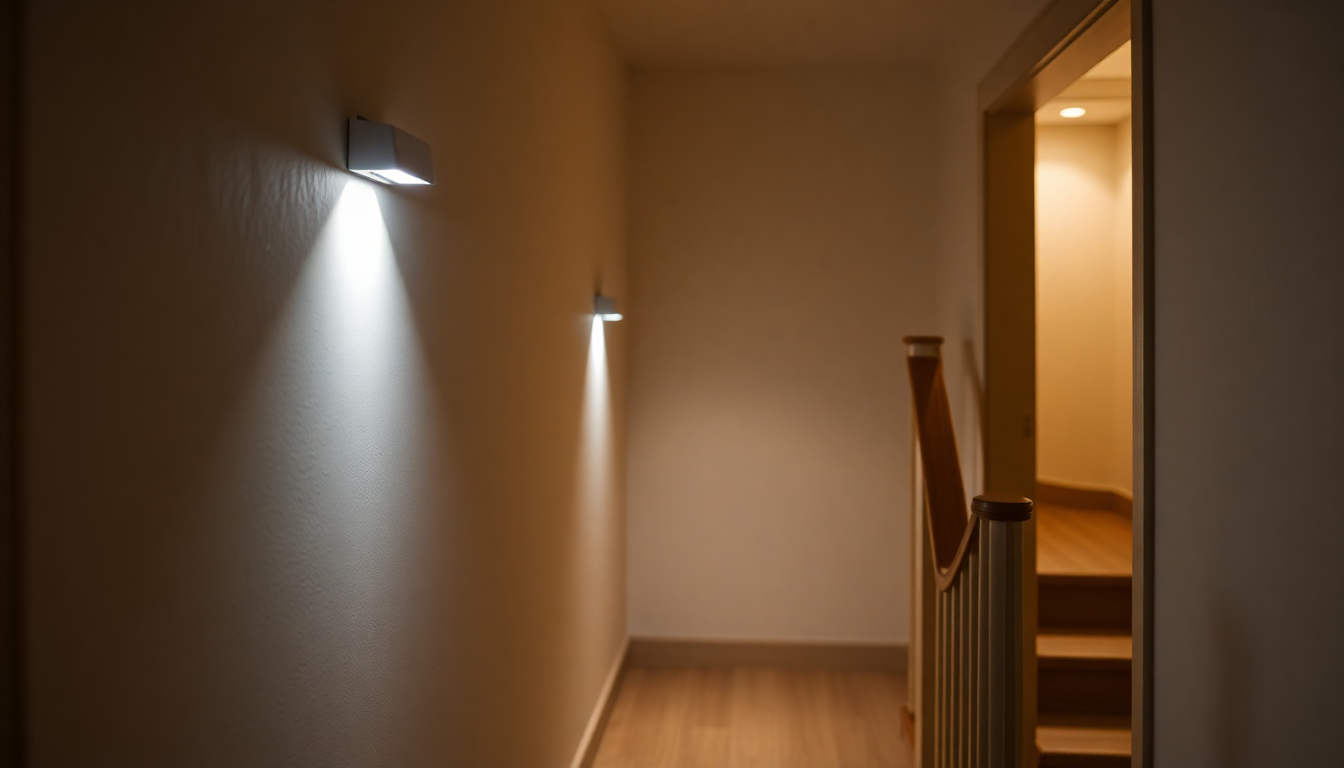
Installation Best Practices
Standardize installation to reduce variation. Document every location and configuration.
- Placement guidance
- Bedrooms: place near the bedroom exit at knee-to-hip height to illuminate the path to the bathroom
- Bathrooms: place to light the doorway and threshold rather than over wet zones
- Hallways: mount on walls at mid-height and at intervals to create continuous low-level illumination
- Stairs: place at landings and top/bottom of stair runs with special attention to glare and shadowing
- Configuration
- Set standard brightness levels and timeout durations across the pilot to avoid variability
- Tune sensor sensitivity to reduce false activations from pets or HVAC movement where applicable
- Document orientation and angle for devices with adjustable heads
- Installation documentation
- Floor plan map with marked device locations and photos
- Device IDs and serial numbers logged against locations
- Initial device test logs: activation test, battery level, and connectivity check
Training and Operational Procedures
Train staff on routine and exceptional procedures. Clear SOPs minimize downtime and resident disruption.
- Charging and battery swaps
- Establish a charging schedule and central charging station for spare batteries
- Document expected charge time and signs of battery degradation
- Troubleshooting guide
- Steps for dead device, intermittent activation, or false triggers
- How to reset or re-pair connected devices if telemetry is used
- Maintenance logging
- Standard form to record service calls, actions taken, parts replaced, and labor time
- Escalation path for warranty replacements
- Resident interaction
- How to record resident feedback, complaints, or suggestions
- Protocol for opt-outs or special accommodation requests
Resident and Staff Communication Templates
Clear communications reduce confusion and build support. Use simple templates and record consent where required.
- Resident notice key points
- Purpose of the pilot: reducing nighttime falls and improving safety
- What to expect: low-level lights installed in specific locations, not cameras
- How to report issues: phone number, email, or maintenance portal
- Opt-out process and contact for questions
- Staff briefing checklist
- Pilot objectives and duration
- Their role: installation support, logging, resident education
- Reporting channels and pilot metrics to monitor
Data Collection Tools and Templates
Standardize data entry to make analysis straightforward.
- Incident report fields
- Date and time
- Location (unit number, corridor, room)
- Activity at time of fall
- Lighting condition and witness statements
- Severity and outcome
- Device telemetry fields (if available)
- Device ID and location
- Activation timestamps
- Battery voltage and charge cycles
- Uptime and connectivity logs
- Maintenance log fields
- Call date and time
- Reported issue
- Action taken and parts used
- Labor hours
- Survey templates
- Simple Likert questions on perceived nighttime safety and lighting quality
- Open-ended feedback fields for suggestions
Pilot Timeline and Milestones
A realistic timeline helps manage expectations and coordinate teams.
- Week 0: Kickoff meeting, finalize pilot charter, procure devices
- Weeks 1–4: Baseline data collection and staff training
- Week 5: Installation and verification across treatment locations
- Weeks 6–20: Pilot run period with continuous data collection (8–16 weeks recommended)
- Weeks 21–24: Data analysis, ROI modeling, and stakeholder report
- Week 25: Decision meeting: scale, iterate, or stop
Statistical Analysis and Interpretation
Use appropriate statistical methods to validate outcomes and avoid overclaiming impact.
- Basic comparisons
- Calculate fall rates per 1,000 resident nights for treatment and control groups before and during the pilot
- Use rate ratios to quantify percent reduction
- Significance testing
- For counts of rare events, use Poisson or negative binomial regression rather than simple t-tests
- Chi-square tests for categorical outcomes when sample sizes permit
- Report confidence intervals to convey uncertainty
- Advanced approaches
- Difference-in-differences to control for time trends between treatment and control
- Interrupted time series analysis for multiple pre- and post-observations
- Regression models that adjust for confounders such as staffing changes, seasonal effects, or resident acuity
- Handling low event counts
- Aggregate longer time windows or larger cohorts to achieve analyzable counts
- Use Bayesian methods or bootstrapping to estimate effect sizes with better small-sample properties
Energy and Maintenance Savings Calculations
Translate technical metrics into dollar savings using clear formulas.
- Energy savings calculation
- kWh_saved = baseline_kW x baseline_hours - pilot_kW x pilot_hours
- Dollar_savings = kWh_saved x utility_rate per kWh
- Include demand charges if applicable for larger properties
- Maintenance savings
- Labor savings = hours_saved x labor_rate
- Parts savings = replacement_parts_avoided x unit_cost
- Emergency call avoidance quantified separately if typical emergency fees exist
- Fall cost avoidance
- Estimate cost per fall including medical treatment, additional care, potential liability, and administrative time
- Use conservative published estimates when organization-specific numbers are not available
ROI, Payback, and Sensitivity Analysis
Build transparent financial models and test assumptions.
- ROI calculation
- Total annual savings = energy_savings + maintenance_savings + fall_cost_avoidance
- Annualized cost = (device_cost + installation + management) / device_lifetime + recurring fees
- ROI = (Total annual savings - Annualized cost) / Annualized cost
- Payback period
- Payback = initial_investment / annual_net_savings
- Sensitivity analysis
- Run conservative, base, and optimistic scenarios for fall reduction, device lifetime, and battery replacement costs
- Identify break-even points where the investment no longer pays off
Hypothetical Case Study: Detailed Example
Example scenario for a 60-unit assisted living building to illustrate analysis steps.
- Pilot design
- 30 treatment units, 30 control units, pilot duration 16 weeks
- Baseline fall rate in these units: 0.08 falls per resident-month
- Observed results
- Treatment group falls during pilot: 2 falls; control group falls: 7 falls
- Calculated treatment fall rate: 2 falls / (30 units x 4 months) = 0.0167 falls per resident-month
- Control fall rate: 7 falls / (30 units x 4 months) = 0.0583 falls per resident-month
- Relative reduction: 71 percent
- Energy and maintenance
- Baseline night lighting energy 600 kWh/month; pilot shows 320 kWh/month — 280 kWh/month saved at $0.12/kWh = $33.60/month
- Maintenance calls reduced from 12/year to 3/year for lighting, saving 9 service calls at 1.5 hours per call and $50/hour labor = $675/year
- Fall-cost avoidance
- Assume conservative avoided cost per fall of $4,000 (medical, administrative)
- Annualized avoided falls extrapolated from pilot = 12 falls avoided per year across building = $48,000/year
- ROI
- Total annual savings ≈ $48,000 + $675 + $403.20 (energy) = $49,078.20
- Initial investment 60 devices at $40/device = $2,400 plus installation and admin $1,600 = $4,000
- Annualized cost assuming 5-year lifetime = $800/year
- ROI = (49,078.20 - 800) / 800 = 60.35x or 6035 percent Annual ROI in this hypothetical
- Interpretation
- Real organizations should use conservative fall-cost estimates and account for non-device confounders. This example demonstrates how fall reductions can dominate ROI calculations.
Privacy, Security, and Regulatory Considerations
- Prefer sensor-only devices and avoid cameras in private spaces unless explicitly consented and legally permitted.
- Encrypt telemetry in transit and at rest. Limit access using role-based permissions.
- Record data retention periods and anonymize personal data where not required.
- Consult local building codes and fire safety regulations for battery installations and disposal practices.
Environmental and End-of-Life Management
- Plan for battery recycling and vendor take-back programs to comply with local e-waste regulations.
- Track device end-of-life and factor replacement or recycling costs into TCO calculations.
- Consider devices with user-replaceable batteries to extend device lifetime and reduce e-waste.
Common Pitfalls and How to Avoid Them
- Pitfall: Insufficient baseline data. Avoid by collecting multiple weeks or months of high-quality baseline metrics.
- Pitfall: No proper control or randomization. Avoid by using matched controls or randomized assignments when feasible.
- Pitfall: Overreliance on anecdotes. Avoid by combining qualitative stories with rigorous quantitative analysis.
- Pitfall: Ignoring human factors. Avoid by iterating on placement, brightness, and schedules based on resident feedback.
- Pitfall: Underestimating battery logistic complexity. Avoid by planning spares, charging workflows, and clear swap procedures.
Decision Framework for Scaling
Use a simple decision matrix to move from pilot to scale.
- Criteria to evaluate
- Fall reduction meets or exceeds target threshold
- Positive net financial case across conservative scenarios
- Operational feasibility: maintenance load manageable and staff trained
- Resident acceptance rate high and few formal complaints
- Vendor reliability and warranty support confirmed
- Actions after positive pilot
- Prioritize high-risk areas for first wave of rollout
- Secure procurement contracts with bulk pricing and service-level agreements
- Develop a phased deployment schedule and maintenance plan
- If results are mixed
- Iterate on configuration and placement, run an extended or expanded pilot
- Consider alternative vendors or hybrid approaches combining wired low-level lighting with rechargeable units
Appendices and Tools to Create
Create these deliverables to reduce friction and ensure repeatability.
- Pilot charter template with objectives, KPIs, roles, and decision criteria
- Installation checklist and device mapping floor plan
- Incident report form and maintenance log spreadsheet
- Resident notice and consent templates
- ROI calculator spreadsheet with variable inputs for fall-cost, device life, and utility rates
- Staff training slide deck and short video demo for device operation
Conclusion
Smart rechargeable night lights can be a high-impact, low-intrusion intervention for reducing nighttime falls, saving energy, and lowering maintenance burden. The financial upside is often driven most strongly by avoided falls, but rigorous pilot testing is essential to prove that outcome in your buildings. Follow this blueprint: define clear KPIs, design an experiment with controls, standardize installation and data collection, analyze with appropriate statistical methods, and build a conservative ROI model. Doing so will reduce risk, improve stakeholder confidence, and set you up for a smooth, evidence-based scale.
Next Steps and Call to Action
Ready to run a pilot? Start by convening your pilot team and completing a pilot charter within the next two weeks. Gather baseline data for 4–12 weeks and procure a small batch of sample devices. If helpful, request the appendix templates listed above to accelerate implementation and ensure consistency across sites. Measure rigorously, document everything, and let the data drive your decision to scale.

Dejar un comentario
Todos los comentarios se revisan antes de su publicación.
Este sitio está protegido por hCaptcha y se aplican la Política de privacidad de hCaptcha y los Términos del servicio.